Posts

Showing posts from June, 2020

CRAME NOTE : HEROMOTOCO- POSITIONAL VIEW

Image
From the life high prices made in 2017, Hero Motor stock price has been on a consistent downward move. Earlier this year the stock fell near to 1500 levels and ever since has been making an attempt to reclaim some of the earlier support levels. The last four weeks price action suggests that the stock can climb to higher levels if it defends 2240-2200 levels which is a significant multi year price action zone. The daily chart suggests the formation of an inverted Head and Shoulders pattern and if the price breaks above the long entry price point mentioned in the chart, it can test higher levels as mentioned. DISCLAIMER The content provided in CRAME blog is for educational purposes only. CRAME or the analyst(s) do(es) not assume any responsibility for the financial decisions/actions made on the basis of the analysis presented in the blog. Analysts Prof. Binu P Paul PhD Prof. Soumya V ACSI

ISCTRI '20 – “International Symposium on Current Trends in Research and Innovation”

Image
ISCTRI '20 – “International Symposium on Current Trends in Research and Innovation” was a technical gathering of academicians and industry experts to deliberate upon the latest research and developments that are gaining momentum in the ever-growing global infrastructure of Computer Science. The online symposium was a great success it took place on 20th of June 2020, the first session of the symposium started at 10:00 AM and went on till 1 PM, there were near about 20 panelists and almost 300 participants which were great.    The first speaker for the session was Dr. Dong Seog Han who spoke about the ability of AI to predict human intentions from behaviour. Then spoke Mr. Kapil Tiwari, who gave us a detailed description of the ML algorithm and the different steps involved in the working of an ML model. The next speaker was Dr. Nilanjan Dey who spoke about the implementation of Deep Learning in Medical Field and also explained the different approaches of deep learning in Medical Data

Blossoms 2020 Interdepartmental competition - Valedictory Ceremony Highlights

Image
Blossoms 2020 an interdepartmental competition, organized by the Student welfare office of Christ (Deemed to be University, Lavasa campus ( The Analytics Hub) began the fun filled journey from the month of April and spanned over 3 months with a wide range of over 20 events which were conducted online to entertain and keep students engaged during the country lockdown. It was a grand success by the active participation of students across every department. Students were competing into 4 clusters namely Raag (BBA A& BBA B) EKYA (BBA C& BCOM) CONSENSIO (BSc, MSc and MBA) and NOMOS HARMONIA (LLB) . The events were designed to bring out the creativity in each student, this helped them to discover more about their hidden talents. After 3 months of non-stop entertainment Blossoms 2020 valedictory function happened online through the Webex platform. Valedictory Ceremony saw participation from faculties and students of all the courses.  The online function began with the address of Fr Jos

CRAME NOTE: SOUTH INDIAN BANK- ACCUMULATE FOR LONG TERM

Image
South Indian Bank , a Kerala based bank has seen precipitous fall in prices in the last couple if years. However the recent price action in the long term chart suggest that the momentum of the fall has reduced. One can also see a positive divergence in MACD . The prices are approaching a primary demand zone . For long term investors this 'accumulation zone' marked in the chart can give a good risk to reward ratio. Given that this is a company that has consistently declared dividends also strengthens the case for long term investors. DISCLAIMER The content provided in CRAME blog is for educational purposes only. CRAME or the analyst(s) do(es) not assume any responsibility for the financial decisions/actions made on the basis of the analysis presented in the blog. Analysts Prof. Binu P Paul PhD Prof. Soumya V ACSI   Note: You can track the progress of this analysis at  https://in.tradingview.com/chart/SOUTHBANK/BjgUsPd3-SOUTH-INDIAN-BANK-ACCUMULATE-FOR-LONG-TERM/

Why can’t India spend like The USA, the answer lies the PARADOX called MMT

Image
By Prof. Stanny Dias Faculty of Management –Marketing Post March there has been so much interest in the economic spending ( Stimulus) of each government towards mitigating the risks arising from the Post Covid Fallout.  See images for comparisons India (Right) vs. the World in terms of GDP Image from Forbes.com and TOI Countries like Japan, the USA have spend more than 13 % of their GDP which in itself dwarfs the spending of emerging countries like India ( 2%), Brazil etc. It has caused a lot of consternation and heart burn among economists and general public at large considering that the poorest reside in these developing or under developed countries like Africa. The poorest demand income support as their livelihoods are upended and the industries require direct cash support now to be viable in the future. However what has been offered by Indian government and RBI has been debt support at favourable interest rates and reforms which may come to fruition in long term. Not exactly rupee

RELIANCE- MOMENTUM DIVERGENCE-BEARISH CANDLE FORMATION

Image
In an earlier post we had looked at the price movement in Reliance with the help of GANN. In this post I want to highlight the momentum divergence in Reliance price movement by looking at Wave analysis. The last wave as per this analysis (assuming the current structure is not compromised by further up move in price) shows momentum divergence. Other conditions for a typical E-Wave are also broadly satisfied by the current move. If the price does not sustain above 1620 levels the stock can witness downward move with targets as mentioned in the chart. DISCLAIMER The content provided in CRAME blog is for educational purposes only. CRAME or the analyst(s) do(es) not assume any responsibility for the financial decisions/actions made on the basis of the analysis presented in the blog. Analysts Prof. Binu P Paul PhD Prof. Soumya V ACSI Note You can track the progress of this analysis by visiting  https://in.tradingview.com/chart/RELIANCE/tvREK3Ar-RELIANCE-MOMENTUM-DIVERGENCE-BEARISH-CANDLE-FOR

From the Counselor's Desk - June 2020

Image
Creative facilitator counselor Ms Aripta Ghosh and Ms Namita Mukerjee presented a webinar on building on inner strength to face turbulent times in our lives. It was a much-needed session that reassured everyone to fight the battle with Covid-19 and be positive.  

CRAME UPDATE : RELIANCE REACHING SHORT ENTRY LEVELS GIVEN ON MAY 15

Dear Christite, Here is the latest analysis about Indian stock market from Center for Research in Asset Markets and Economy (CRAME), Christ (Deemed to be University) Lavasa. RELIANCE undoubtedly is a stock that managed to dodge the market carnage and gained significantly in the last two months. However the shorter time frame chart suggests profit booking and this could continue. The stock can find significant resistance near 1530-1570 levels. Upper range of this level can be used as a stop loss and any move towards these levels can be used to initiate short positions. Possible downside targets are marked in the chart.  Refer the below link for chart https://in.tradingview.com/ chart/RELIANCE/4169gvaT- RELIANCE-INDUSTRIES- Consolidation-with-Downward- Bias/   DISCLAIMER The content provided in CRAME blog is for educational purposes only. CRAME or the analyst(s) do(es) not assume any responsibility for the financial decisions/actions made on the basis of the analysis presented in the bl

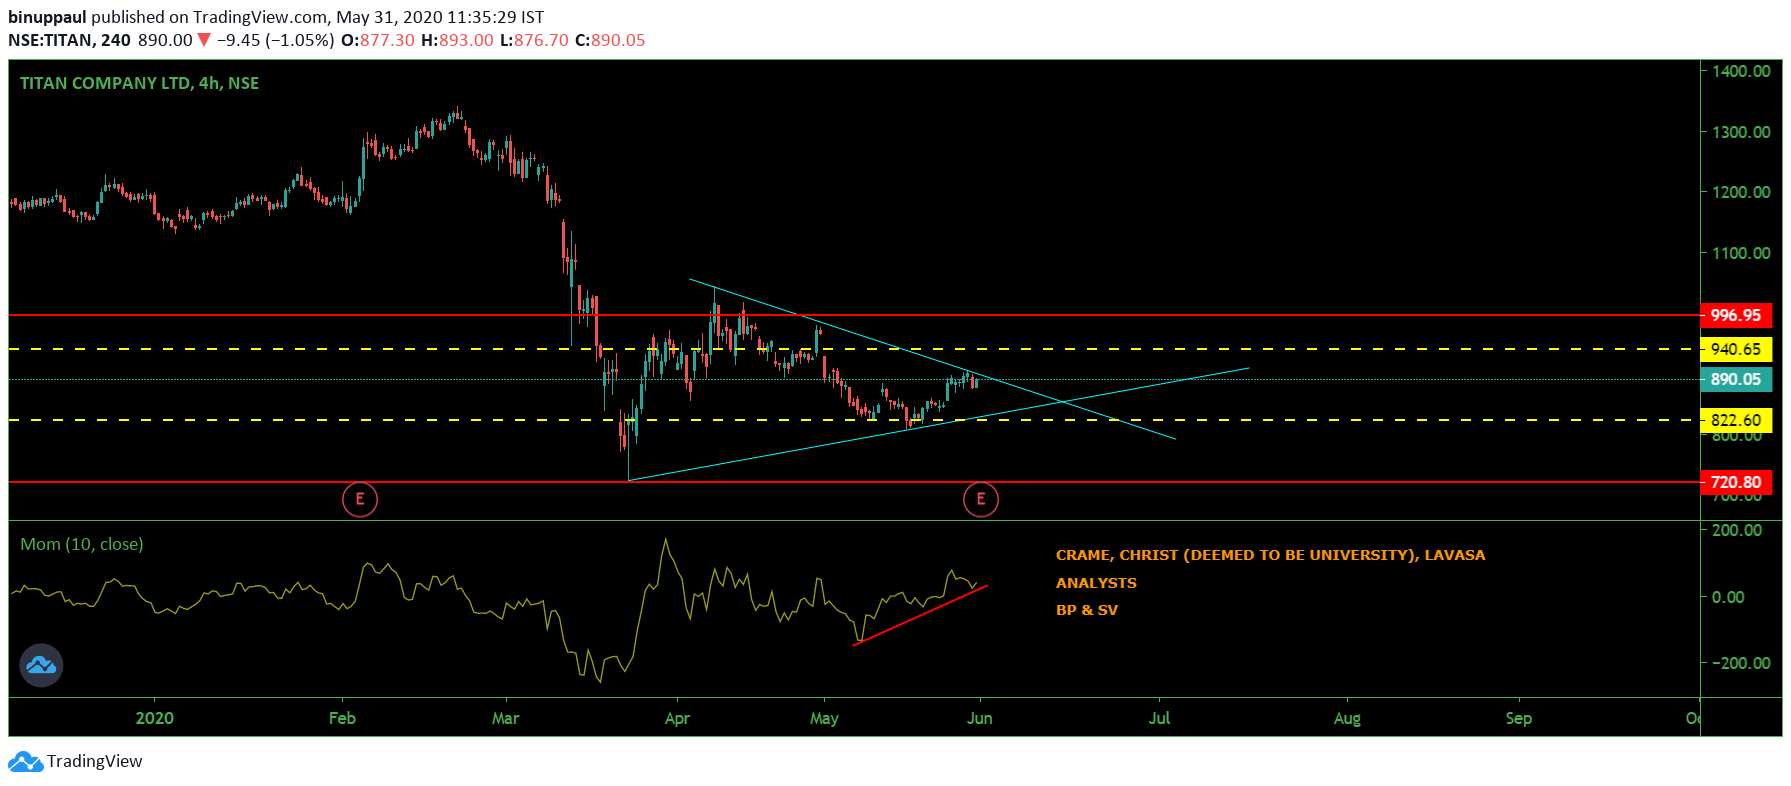
CRAME NOTE : TITAN - WATCHOUT FOR THESE LEVELS

Image
Dear Christite, Here is the latest analysis about Indian stock market from Center for Research in Asset Markets and Economy (CRAME), Christ (Deemed to be University) Lavasa. Titan, one of the darling stocks in discretionary consumption space had taken a beating in the recent market fall. After the down move the prices have been consolidating in a triangle and could provide trading opportunities on both sides. However the short term indicator setup suggests that a long trade near the levels mentioned in the chart can be quite rewarding. If the prices manage to stay above 816-822 levels , it can test the upside targets given in the chart once the price breaks above the current triangle formation. The momentum in the short term chart suggests that there is some more steam left in the up move. If the price stays below the mentioned level it can test lower targets mentioned in the chart. Will update this chart if a sell condition in the indicator setup is confirmed. DISCLAIMER The content p