SPSS WORKSHOP
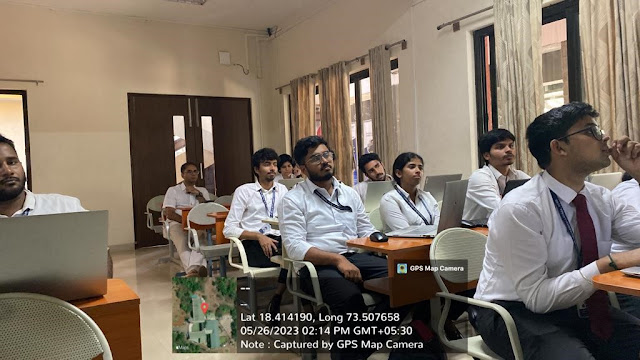
School of Commerce & Management organized a one-day workshop on SPSS Software for MBA Finance students. The Workshop was organized on 26th May 2023 from 1:30 PM to 3:00 PM. Prof. Maaz Hasan Khan, Prof. Danish Hussain, and Prof. Shrutika Mishra were the resource people for the event. The purpose & Objectives of the Workshop on SPSS were to provide basic knowledge regarding SPSS software to the students. To provide training on how to perform important statistical calculations using SPSS software. To discuss different aspects of SPSS Software in research. To promote research culture among students. Points discussed in the Workshop: Basics of SPSS Software, different aspects of SPSS Software in research, use of various functions in SPSS software to perform Data Analysis, and student’s doubts regarding the SPSS software were discussed and solved.
While Alchemer has powerful built-in reporting features that are easy to use and present for most online surveys, NPS surveys, and employee satisfaction surveys, when it comes to in-depth statistical analysis most researchers consider SPSS the best-in-class solution.
SPSS is short for Statistical Package for the Social Sciences, and it’s used by various kinds of researchers for complex statistical data analysis. The SPSS software package was created for the management and statistical analysis of social science data. It was originally launched in 1968 by SPSS Inc. and was later acquired by IBM in 2009. Officially dubbed IBM SPSS Statistics, most users still refer to it as SPSS. As the world standard for social science data analysis, SPSS is widely coveted due to its straightforward and English-like command language and impressively thorough user manual. SPSS is used by market researchers, health researchers, survey companies, government entities, education researchers, marketing organizations, data miners, and many more for processing and analyzing survey data, such as you collect with an online survey platform like Alchemer. Most top research agencies use SPSS to analyze survey data and mine text data so that they can get the most out of their research and survey projects. SPSS offers four programs that assist researchers with their complex data analysis needs. SPSS’s Statistics program provides a plethora of basic statistical functions, some of which include frequencies, cross-tabulation, and bivariate statistics. SPSS’s Modeler program enables researchers to build and validate predictive models using advanced statistical procedures. SPSS’s Text Analytics for Surveys program helps survey administrators uncover powerful insights from responses to open-ended survey questions. SPSS contains all basic statistical tests and multivariate analyses such as t-tests; chi-square tests; ANOVA; correlations and other association measures; regression; nonparametric tests; factor analysis; cluster analysis. SPSS data can be saved as a variety of file formats, including MS Excel; plain text (.txt or .csv); Stata SAS. The options for output are even more elaborate: charts are often copy-pasted as images in .png format. For tables, rich text format is often used because it retains the tables’ layout, fonts and borders. Besides copy-pasting individual output items, all output items can be exported in one go to .pdf, HTML, MS Word and many other file formats. A terrific strategy for writing a report is creating an SPSS output file with nicely styled tables and chart. Then export the entire document to Word and insert explanatory text and titles between the output items. Some analyses are available only after purchasing additional SPSS options on top of the main program. An overview of all commands and the options to which they belong is presented in Overview All SPSS Commands. SPSS’s Visualization Designer program allows researchers to use their data to create a wide variety of visuals like density charts and radial boxplots from their survey data with ease. SPSS provides data analysis for descriptive and bivariate statistics, numeral outcome predictions and predictions for identifying groups. The software also provides data transformation, graphing and direct marketing features. The software interface displays open data similarly to a spreadsheet in its main view. With its secondary variable view, the metadata that describes the variables and data entries present in the data file are displayed. The software package was created in 1968 by SPSS Inc. and was acquired by IBM in 2009. While the software was renamed to IBM SPSS Statistics, it is still commonly referred to as just SPSS.In short, remember to use SPSS when you need a flexible, customizable way to get super granular on even the most complex data sets. This gives you, the researcher, more time to do what you do best — identifying trends, developing predictive models, and drawing informed conclusions.


Comments
Post a Comment