Hands on Workshop on PowerBI

The primary objective of the 4-day Power BI workshop was to equip participants with the necessary skills to harness the full potential of Power BI. Whether participants were beginners or had some prior experience, the workshop aimed to enable them to create dynamic, interactive reports and dashboards. The focus was not just on the technical aspects of Power BI but also on understanding how to make data accessible, understandable, and actionable for effective decision-making.

Day 1: Getting Started with Power BI
The workshop commenced with an introduction to Power BI, where participants were guided through the installation process. Ensuring that everyone was set up correctly was crucial to smooth progress over the following days. The importance of keeping Power BI updated was emphasized, as new features and improvements regularly enhance the platform's capabilities.
Following the setup, the session covered an overview of Power BI, highlighting why it stands out among other business intelligence tools. The discussion touched on how Power BI converts raw data into actionable insights, underscored by its consistent recognition as a leader in the Gartner Magic Quadrant survey. This provided participants with a strong understanding of Power BI’s significance and potential impact on data analysis.


Participants were then introduced to the Power BI interface. They explored its layout, getting acquainted with the location of key features and functionalities. This foundational knowledge was critical for building confidence in using the tool effectively. To put theory into practice, participants worked with a clean sales dataset, experimenting with various visualization techniques such as bar, line, and pie charts. These visualizations were enhanced with slicers, allowing for interactive data filtering that made the reports more dynamic and tailored.
The day concluded with a practical exercise. Participants were tasked with using a sports dataset to create their own visualizations. This assignment provided an excellent opportunity to apply the skills learned during the session, reinforcing the importance of visualizing data in a way that effectively communicates insights.


Day 2: Advanced Features and Techniques
On the second day, the workshop delved into more advanced features of Power BI, enhancing its functionality and analytical power. Participants were introduced to custom tooltips, which allow for the display of additional information and context when interacting with visual elements. This feature improves the user experience by presenting complex information in an easily understandable manner.
The session also covered various Power BI visuals and formatting options. Participants learned how to customize visuals to meet specific reporting requirements, adjusting settings to better represent data and improve readability. Additionally, the workshop introduced AI-driven visuals such as Key Influencers, the Decomposition Tree, and the Q&A feature. These tools provide deep insights into data by identifying key metrics, breaking down data into contributing factors, and allowing users to ask questions in natural language to generate quick, insightful responses.

The use of Field Parameters was another key topic, teaching participants how to enhance interactivity and flexibility in their reports by dynamically changing the data displayed based on user selections. The session also included a thorough overview of Data Analysis Expressions (DAX) and the creation of new measures, both of which are essential for performing complex calculations and aggregations in Power BI.
To apply these concepts, participants engaged in a case study focused on HR Analytics. They were tasked with creating an Employee Attrition Dashboard, analyzing and visualizing employee turnover data using various Power BI features. This hands-on activity reinforced their understanding of the tools and demonstrated their practical applications in a real-world scenario.
Day 3: Power Query Editor and Data Transformation
Day three introduced participants to the Power Query Editor, a vital tool for cleaning, shaping, and transforming data before loading it into Power BI. The session began with an exploration of the Power Query interface, providing participants with the foundational knowledge needed to navigate and utilize this powerful tool effectively.
The workshop then covered the ETL (Extract, Transform, Load) process, which is central to Power Query’s functionality. Participants learned how to pull data from different sources, transform it to fit their needs, and load it into their data model for analysis. The session also introduced the VertiPaq Storage Engine, which ensures efficient data storage and quick access, enhancing the speed and performance of data analysis.
Practical exercises involved working with datasets named "power query 1" and "power query 2," where participants practiced promoting and demoting headers, keeping and removing rows, changing data types, and more. They also explored advanced techniques like filling values up and down, unpivoting columns, splitting columns, and renaming them. The "Add Column from Example" feature was particularly noteworthy, allowing participants to create new columns based on identified patterns, thereby simplifying the data transformation process.
Despite some challenges—such as understanding the correct order of transformations and navigating the myriad options within the Power Query interface—participants gained valuable experience in preparing data for analysis. The day’s activities helped build their confidence in using Power BI for real-world data transformation tasks.
Day 4: Power Query Transformations and Data Modeling
The final day of the workshop focused on more advanced Power Query transformations and data modeling. Participants explored the Transpose function, which is essential for rearranging data by flipping rows into columns and vice versa. They also learned the differences between Pivot and Unpivot, two powerful techniques for reshaping data either to summarize it or to normalize it for detailed analysis.
The Replace Value function was another key topic, helping participants understand how to clean and standardize data by finding and replacing specific values within a column. This session also covered formatting text columns to ensure data is presented professionally and consistently.
In addition to these transformations, the workshop reviewed standard operations and statistical functions in Power Query, such as sorting, filtering, and performing basic statistical calculations. Participants practiced applying these operations to clean and prepare data, enhancing their understanding of practical applications.
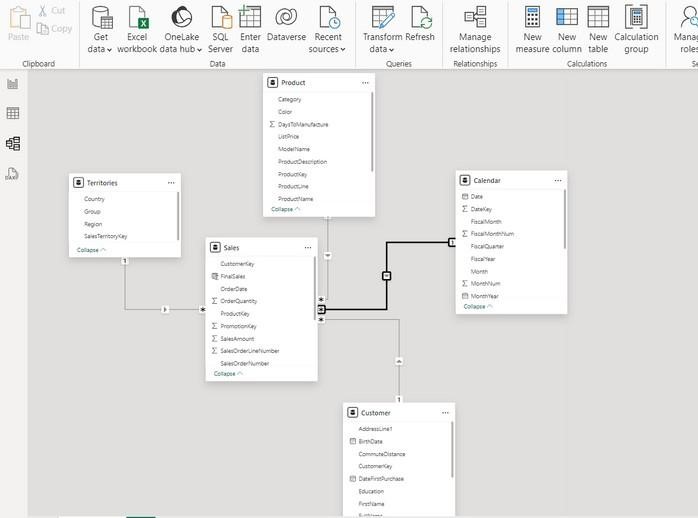
The session concluded with a discussion on data modeling, focusing on the differences between Fact Tables and Dimension Tables, the Star Schema, and building relationships between tables. Participants practiced troubleshooting common data model issues, such as circular references and incorrect relationships, and learned about the importance of cardinality in setting up accurate relationships.
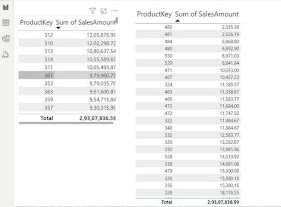
The day also included a comparison of new columns and new measures, helping participants understand when to use each based on their analysis needs and performance considerations. Practical exercises with datasets like Merge-Sales_Database and AdventureWorks_Database reinforced the concepts covered throughout the day.

Summary of Learning Outcomes
Over the course of the workshop, participants acquired several critical skills:
● Data Connection and Transformation: Participants learned how to connect Power BI to various data sources, including Excel, SQL databases, and online services. They also explored Power Query to clean and transform data, ensuring it was ready for analysis.
● Data Visualization: The workshop covered the creation of diverse and interactive visualisations, such as bar charts, pie charts, and maps. Participants gained hands-on experience in customising these visuals to effectively communicate insights.
● DAX Functions: Participants were introduced to Data Analysis Expressions (DAX), enabling them to create custom calculations and advanced measures within their reports.
● Report Publishing and Sharing: The final day focused on publishing reports to the Power BI Service, sharing insights with stakeholders, and leveraging the platform’s collaboration features.
● Real-Time Data Analysis: The workshop also touched on connecting to real-time data feeds, enabling dynamic and up-to-date reporting.
Reflections on the Workshop
The workshop was an engaging and enriching experience for both participants and facilitators. Participants appreciated the hands-on approach, which allowed them to immediately apply what they learned in real-world scenarios. The step-by-step guidance provided by the facilitators helped demystify complex concepts, making Power BI accessible even to those with limited prior experience in data analysis.
Interactive discussions were a highlight of the workshop, where participants shared their insights and real-life challenges. This collaborative environment not only fostered learning but also showcased the diverse applications of Power BI across different industries.
Overall, the workshop succeeded in making data analysis less intimidating and more approachable. Participants left with a newfound enthusiasm for continuing their journey with Power BI, recognizing its potential to drive smarter business decisions and uncover hidden trends in their data.


Appwars Technologies offers a top-tier Power BI course in Noida designed to equip students with essential data visualization and business intelligence skills. With real-time, project-based learning and experienced trainers, this course provides hands-on experience in creating interactive dashboards, reports, and analyzing data. Ideal for beginners and professionals looking to enhance their data analysis capabilities, Appwars ensures practical knowledge and job placement assistance to help you excel in Power BI.
ReplyDeleteThis "Hands on Workshop on PowerBI" is an excellent initiative for gaining practical insights into data visualization and analytics. If you're looking to implement real-time dashboards for your business, consider to Hire Power BI Developers for expert support.
ReplyDeleteThis hands-on workshop on Power BI offers great practical insights for data visualization and analytics. To turn workshop learning into real-world solutions, Hire Power BI Developers who can transform your data into actionable business intelligence. Excellent initiative!
ReplyDeleteGreat, practical guide — thank you for this clear overview of Power BI consulting services and how they help organisations turn raw data into actionable insights. The post explains dashboard design, data modelling, and governance in a concise way that’s useful for decision-makers and analysts alike. For teams looking to implement Power BI quickly and effectively, check this resource: Power BI Consulting Services UAE.
ReplyDeleteGreat initiative by your institution! This hands-on workshop on Power BI not only demystifies data visualisation, but also lays a strong foundation for meaningful business insights. For organisations looking to upscale their reporting capabilities, partnering with a reliable Power BI dashboard consulting services provider can turn these skills into fully-fledged strategic dashboards.
ReplyDeleteThank you for this informative blog—clearly explains how database management services support performance, security, and business continuity. bi and analytics services
ReplyDeletepower bi consulting services
ReplyDelete
ReplyDeleteReally enjoyed this post! The way you explained the concepts with simple examples made the good knowledge of power-bi much easier to understand.Very useful content for beginners as well as learners who want to improve their power-bi skills. Keep sharing such valuable information!