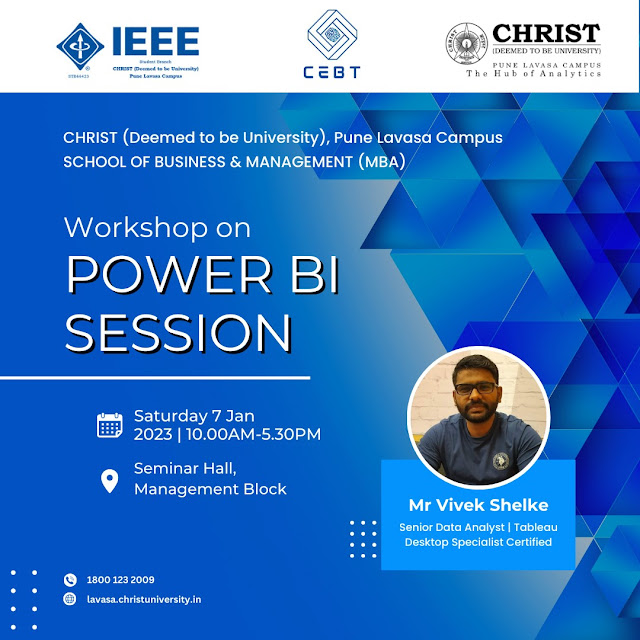
Power BI Workshop
Attendance: The workshop was attended by 67 MBA students, representing Christ University Pune Lavasa Campus. The attendees were a mix of students from different backgrounds, with varying levels of experience in data analysis and business intelligence.
Agenda: The workshop consisted of the following sessions:
Introduction to Power BI: This session provided an overview of the platform, including its key features and capabilities. The attendees were introduced to the Power BI Desktop, Power BI Service, and Power BI mobile app. They also learned about the Power BI dataflow and the Power BI data modeling concepts.
Data Connectivity and Transformation: Participants learned how to connect to and transform data from a variety of sources, including Excel, SQL Server, and Power Query. They practiced importing data from different sources and transforming it into a format that can be used for analysis and visualization.
Data Modeling and Visualization: Attendees were introduced to the concepts of data modeling and visualization, and learned how to create interactive charts and tables using Power BI. They practiced creating visualizations such as bar charts, line charts, scatter plots, and tables. They also learned how to format and customize the visualizations to make them more visually appealing and informative.
Dashboards and Reports: Participants learned how to create and share interactive dashboards and reports, and how to publish them to the web. They practiced creating dashboards and reports using the data they previously imported and transformed. They also learned how to use the Power BI report server to share the reports with others.
Advanced Features: The final session covered advanced features of Power BI, such as calculated tables, custom visuals, and data analysis using R and Python. The attendees were introduced to the Power BI custom visuals gallery and learned how to use R and Python scripts in Power BI.
Feedback: Overall, the feedback from the attendees was positive. They particularly appreciated the hands-on approach of the workshop, as well as the opportunity to work with real-world data. They found the step-by-step instructions and examples provided during the workshop to be very helpful in understanding the concepts and features of Power BI. Some attendees commented that they would have liked more time to work on their own projects, but overall they felt that the workshop was a valuable learning experience.
Conclusion: The Power BI workshop was a success in providing MBA students of Christ University Pune Lavasa Campus with a comprehensive understanding of the platform, and equipping them with the skills necessary to create and share interactive data visualizations and reports. The attendees gained valuable knowledge and skills that will be useful for their future careers in business and management. We will continue to monitor the feedback and will make necessary adjustments for the next session.


The "Power BI Workshop" offers a great hands-on opportunity to explore data visualization and analytics tools. If you're aiming to scale your BI capabilities, consider to Hire Power BI Developers for tailored dashboards and seamless data integration.
ReplyDelete